Data visualization is a trending web & mobile development technology that engages your users to explore data in a simple & clear way.
Want to have a chart library to visualize various types of data in your Vue.js app.
Have you found that it is difficult to integrate the popular JavaScript chart library with your web applications?
Here is a list of the 10 best and top-rated charting and graphing libraries for Vue.js that makes it easier to plot the data you provide to interactive, customizable charts & graphs on the web app. Have fun.
Originally published Feb 12 2020, updated Aug 05 2025
10 Best Chart Libraries For Vue.js:
1. Vue.js Wrapper For Chart.js

A Vue.js wrapper for Chart.js that helps you create reuseable charts for your Vuejs applications.
2. org-chart

Highly customizable org chart. Integrations available for Angular, React, Vue.
3. carbon-charts
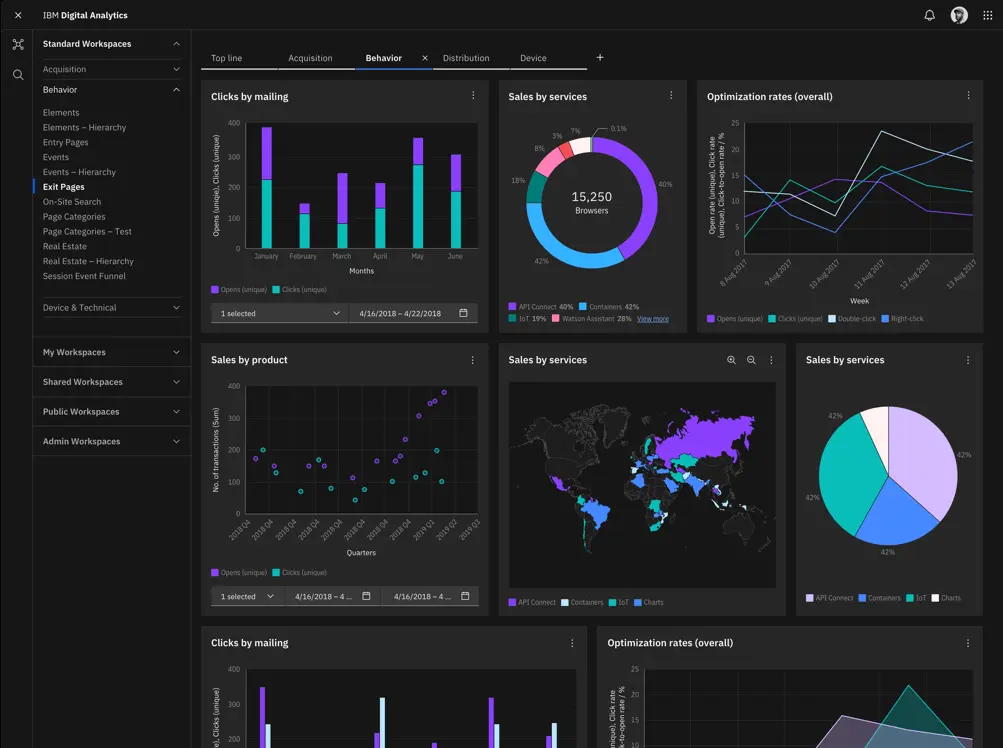
A component library of 26 charts for vanilla JavaScript, Svelte, React, Vue.js and Angular.
4. vue-chartkick

Vue Chartkick is a lightweight Vue.js component for creating beautiful charts using Chart.js, Google Charts, and Highcharts.
5. Simple Draggable Gantt Chart For Vue – Ganttastic

A small Vue.js component to render a configurable, draggable Gantt chart on the web applications.
Features:
- Vue 3 support
- TypeScript support (ships with out of the box type declarations)
- Interactivity (dynamic, movable and pushable bars)
- Reactivity / Responsiveness (when changes occur, bars are repositioned accordingly)
- Customization options (chart/bar styling, slots, event handlers etc.)
6. Reactive Vue.js Wrapper For Google Charts – GChart

The GChart component is a Vue.js wrapper for the original Google Charts that features reactive data binding. A chart will be redrawn automatically once the data, type, and options prop is changed.
7. ag-charts
AG Charts is a fully-featured and highly customizable canvas-based JavaScript Charting library. It delivers outstanding performance, has no third-party dependencies, and comes with support for React , Angular and Vue.
8. Vue-chrts
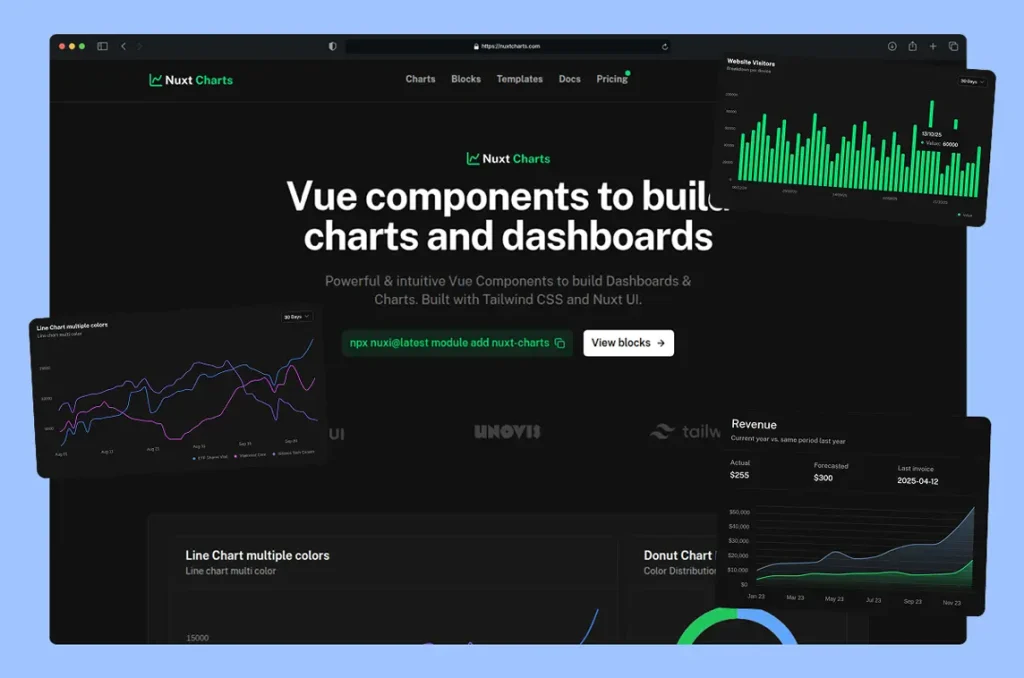
A Vue 3 charts package inspired by Tremor, built on top of Unovis. Vue-Chrts provides beautiful, responsive charts for your Vue applications with minimal setup.
9. SVG-based Charting Library For Vue 3
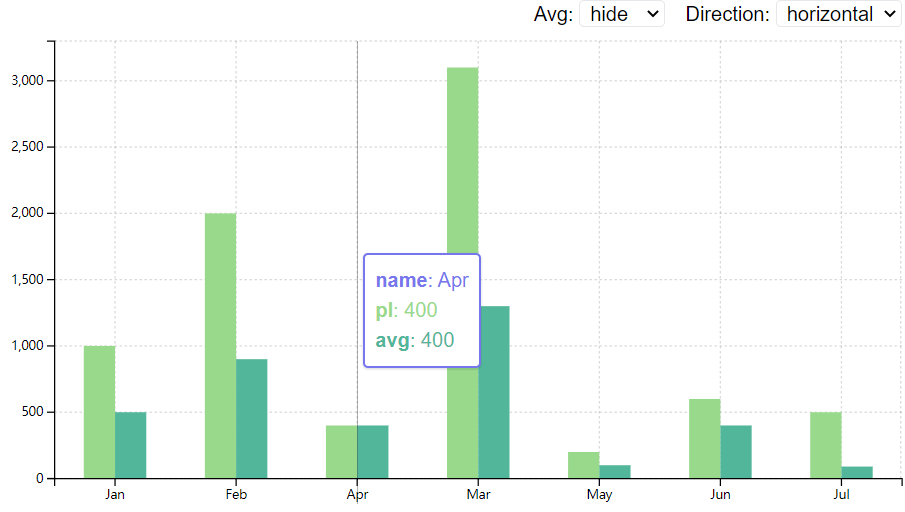
An easy, extensible, intuitive data visualization library for generating SVG-based charts in Vue 3 applications.
10. Pure CSS Donut Charts For Vue.js
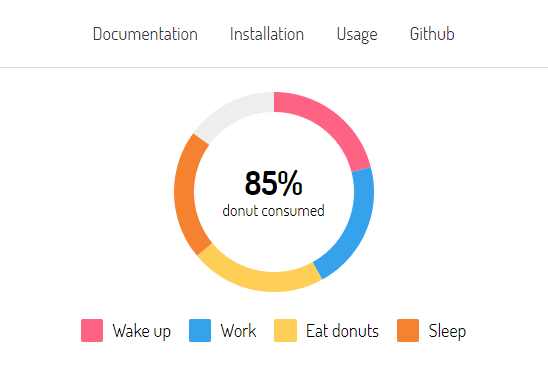
A lightweight Vue component for drawing donut charts on apps using CSS. Compatible with both Vue 3 and Vue.2.
More Resources:
There are many chart libraries out there and the libraries listed here are just a few of those popular chart libraries.
To find more JavaScript libraries and Vue.js components for data visualization, here are a few more resources available online:
- Vue.js Chart & Graph Components
- Best Chart & Graph Components For React And React Native
- Best Angular Chart Libraries For Data Visualization
- Vanilla JavaScript & Pure CSS Chart Libraries
- 10 Best Pie/Donut Chart Plugins In JavaScript