Install & Download:
# Yarn
$ yarn add vue3-charts
# NPM
$ npm i vue3-charts
Description:
An easy, extensible, intuitive data visualization library for generating SVG-based charts in Vue 3 applications.
Currently supports 3 chart types: Line, Bar, and Area. More types are coming soon.
Basic Usage:
1. Import needed components.
import { defineComponent, ref } from 'vue'
import { Chart, Grid, Line } from 'vue3-charts'
2. Import your data to be presented in the chart.
export const plByMonth = [
{ name: 'Jan', pl: 1000, avg: 500, inc: 300 },
{ name: 'Feb', pl: 2000, avg: 900, inc: 400 },
{ name: 'Apr', pl: 400, avg: 400, inc: 500 },
{ name: 'Mar', pl: 3100, avg: 1300, inc: 700 },
{ name: 'May', pl: 200, avg: 100, inc: 200 },
{ name: 'Jun', pl: 600, avg: 400, inc: 300 },
{ name: 'Jul', pl: 500, avg: 90, inc: 100 }
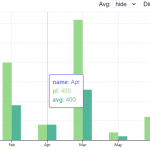
]import { plByMonth } from '@/data'3. Create a bar chart.
<template>
  <Chart
    :size="{ width: 500, height: 420 }"
    :data="data"
    :margin="margin"
    :direction="direction"
    :axis="axis">
    <template #layers>
      <Grid strokeDasharray="2,2" />
      <Bar :dataKeys="['name', 'pl']" :barStyle="{ fill: '#90e0ef' }" />
      <Bar :dataKeys="['name', 'avg']" :barStyle="{ fill: '#0096c7' }" />
      <Bar :dataKeys="['name', 'inc']" :barStyle="{ fill: '#48cae4' }" />
      <Marker :value="1000" label="Avg." color="#e76f51" strokeWidth="2" strokeDasharray="6 6" />
    </template>
    <template #widgets>
      <Tooltip
        borderColor="#48CAE4"
        :config="{
          pl: { color: '#90e0ef' },
          avg: { color: '#0096c7' },
          inc: { color: '#48cae4' }
        }"
      />
    </template>
  </Chart>
</template>
export default defineComponent({
name: 'LineChart',
components: { Chart, Grid, Line },
setup() {
const data = ref(plByMonth)
const direction = ref('horizontal')
const margin = ref({
left: 0,
top: 20,
right: 20,
bottom: 0
})
const axis = ref({
primary: {
type: 'band'
},
secondary: {
domain: ['dataMin', 'dataMax + 100'],
type: 'linear',
ticks: 8
}
})
return { data, direction, margin, axis }
}
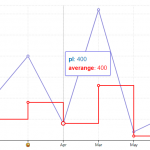
})4. Create a line chart.
<template>
  <Chart
    :size="{ width: 500, height: 420 }"
    :data="data"
    :margin="margin"
    :direction="direction"
    :axis="axis">
    <template #layers>
      <Grid strokeDasharray="2,2" />
      <Line :dataKeys="['name', 'pl']" />
      <Line :dataKeys="['name', 'avg']" :lineStyle="{ stroke: 'red' }" type="step" />
    </template>
    <template #widgets>
      <Tooltip
        borderColor="#48CAE4"
        :config="{
          name: { hide: true },
          pl: { color: '#0077b6' },
          avg: { label: 'averange', color: 'red' },
          inc: { hide: true }
        }"
      />
    </template>
  </Chart>
</template>
export default defineComponent({
name: 'LineChart',
components: { Chart, Grid, Line },
setup() {
const data = ref(plByMonth)
const direction = ref('horizontal')
const margin = ref({
left: 0,
top: 20,
right: 20,
bottom: 0
})
const axis = ref({
primary: {
type: 'band',
format: (val: string) => {
if (val === 'Feb') {
return '😜'
}
return val
}
},
secondary: {
domain: ['dataMin', 'dataMax + 100'],
type: 'linear',
ticks: 8
}
})
return { data, direction, margin, axis }
}
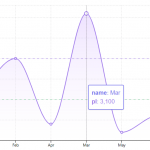
})5. Create an area chart.
<template>
  <Chart
    :size="{ width: 500, height: 420 }"
    :data="data"
    :margin="margin"
    :direction="direction"
    :axis="axis">
    <template #layers>
      <Grid strokeDasharray="2,2" />
      <Area :dataKeys="['name', 'pl']" type="monotone" :areaStyle="{ fill: 'url(#grad)' }" />
      <Line
        :dataKeys="['name', 'pl']"
        type="monotone"
        :lineStyle="{
          stroke: '#9f7aea'
        }"
      />
      <Marker v-if="marker" :value="1000" label="Mean." color="green" strokeWidth="2" strokeDasharray="6 6" />
      <defs>
        <linearGradient id="grad" gradientTransform="rotate(90)">
          <stop offset="0%" stop-color="#be90ff" stop-opacity="1" />
          <stop offset="100%" stop-color="white" stop-opacity="0.4" />
        </linearGradient>
      </defs>
    </template>
    <template #widgets>
      <Tooltip
        borderColor="#48CAE4"
        :config="{
          pl: { color: '#9f7aea' },
          avg: { hide: true },
          inc: { hide: true }
        }"
      />
    </template>
  </Chart>
</template>
export default defineComponent({
name: 'LineChart',
components: { Chart, Grid, Line },
setup() {
const data = ref(plByMonth)
const direction = ref('horizontal')
const margin = ref({
left: 0,
top: 20,
right: 20,
bottom: 0
})
const axis = ref({
primary: {
type: 'band'
},
secondary: {
domain: ['dataMin', 'dataMax + 100'],
type: 'linear',
ticks: 8
}
})
return { data, direction, margin, axis }
}
})6. Stacked chart is supported as well.
<template>
  <Chart
    :size="{ width: 500, height: 420 }"
    :data="data"
    :margin="margin"
    :direction="direction"
    :axis="axis">
    <template #layers>
      <Grid strokeDasharray="2,2" />
      <Area :dataKeys="['name', 'pl']" type="monotone" :areaStyle="{ fill: 'url(#grad)' }" />
      <Line
        :dataKeys="['name', 'pl']"
        type="monotone"
        :lineStyle="{
          stroke: '#9f7aea'
        }"
      />
      <Marker v-if="marker" :value="1000" label="Mean." color="green" strokeWidth="2" strokeDasharray="6 6" />
      <defs>
        <linearGradient id="grad" gradientTransform="rotate(90)">
          <stop offset="0%" stop-color="#be90ff" stop-opacity="1" />
          <stop offset="100%" stop-color="white" stop-opacity="0.4" />
        </linearGradient>
      </defs>
    </template>
    <template #widgets>
      <Tooltip
        borderColor="#48CAE4"
        :config="{
          pl: { color: '#9f7aea' },
          avg: { hide: true },
          inc: { hide: true }
        }"
      />
    </template>
  </Chart>
</template>
export default defineComponent({
name: 'LineChart',
components: { Chart, Grid, Line },
setup() {
const data = ref(plByMonth)
const direction = ref('horizontal')
const margin = ref({
left: 0,
top: 20,
right: 20,
bottom: 0
})
const axis = ref({
primary: {
type: 'band'
},
secondary: {
domain: ['dataMin', 'dataMax + 100'],
type: 'linear',
ticks: 8
}
})
return { data, direction, margin, axis }
}
})Previews:
Changelog:
v1.1.33 (02/04/2023)
- Bugfix
v1.1.32 (11/23/2022)
- Bugfix
v1.1.31 (03/09/2022)
- Add ability to rotate X axis
v1.1.28 (02/01/2022)
- Remove r.uniq to allow unique data
v1.1.26 (12/12/2021)
- Update
v1.1.25 (11/20/2021)
- Update tooltip to support color by function
v1.1.22 (09/01/2021)
- Update axisSize based on font size